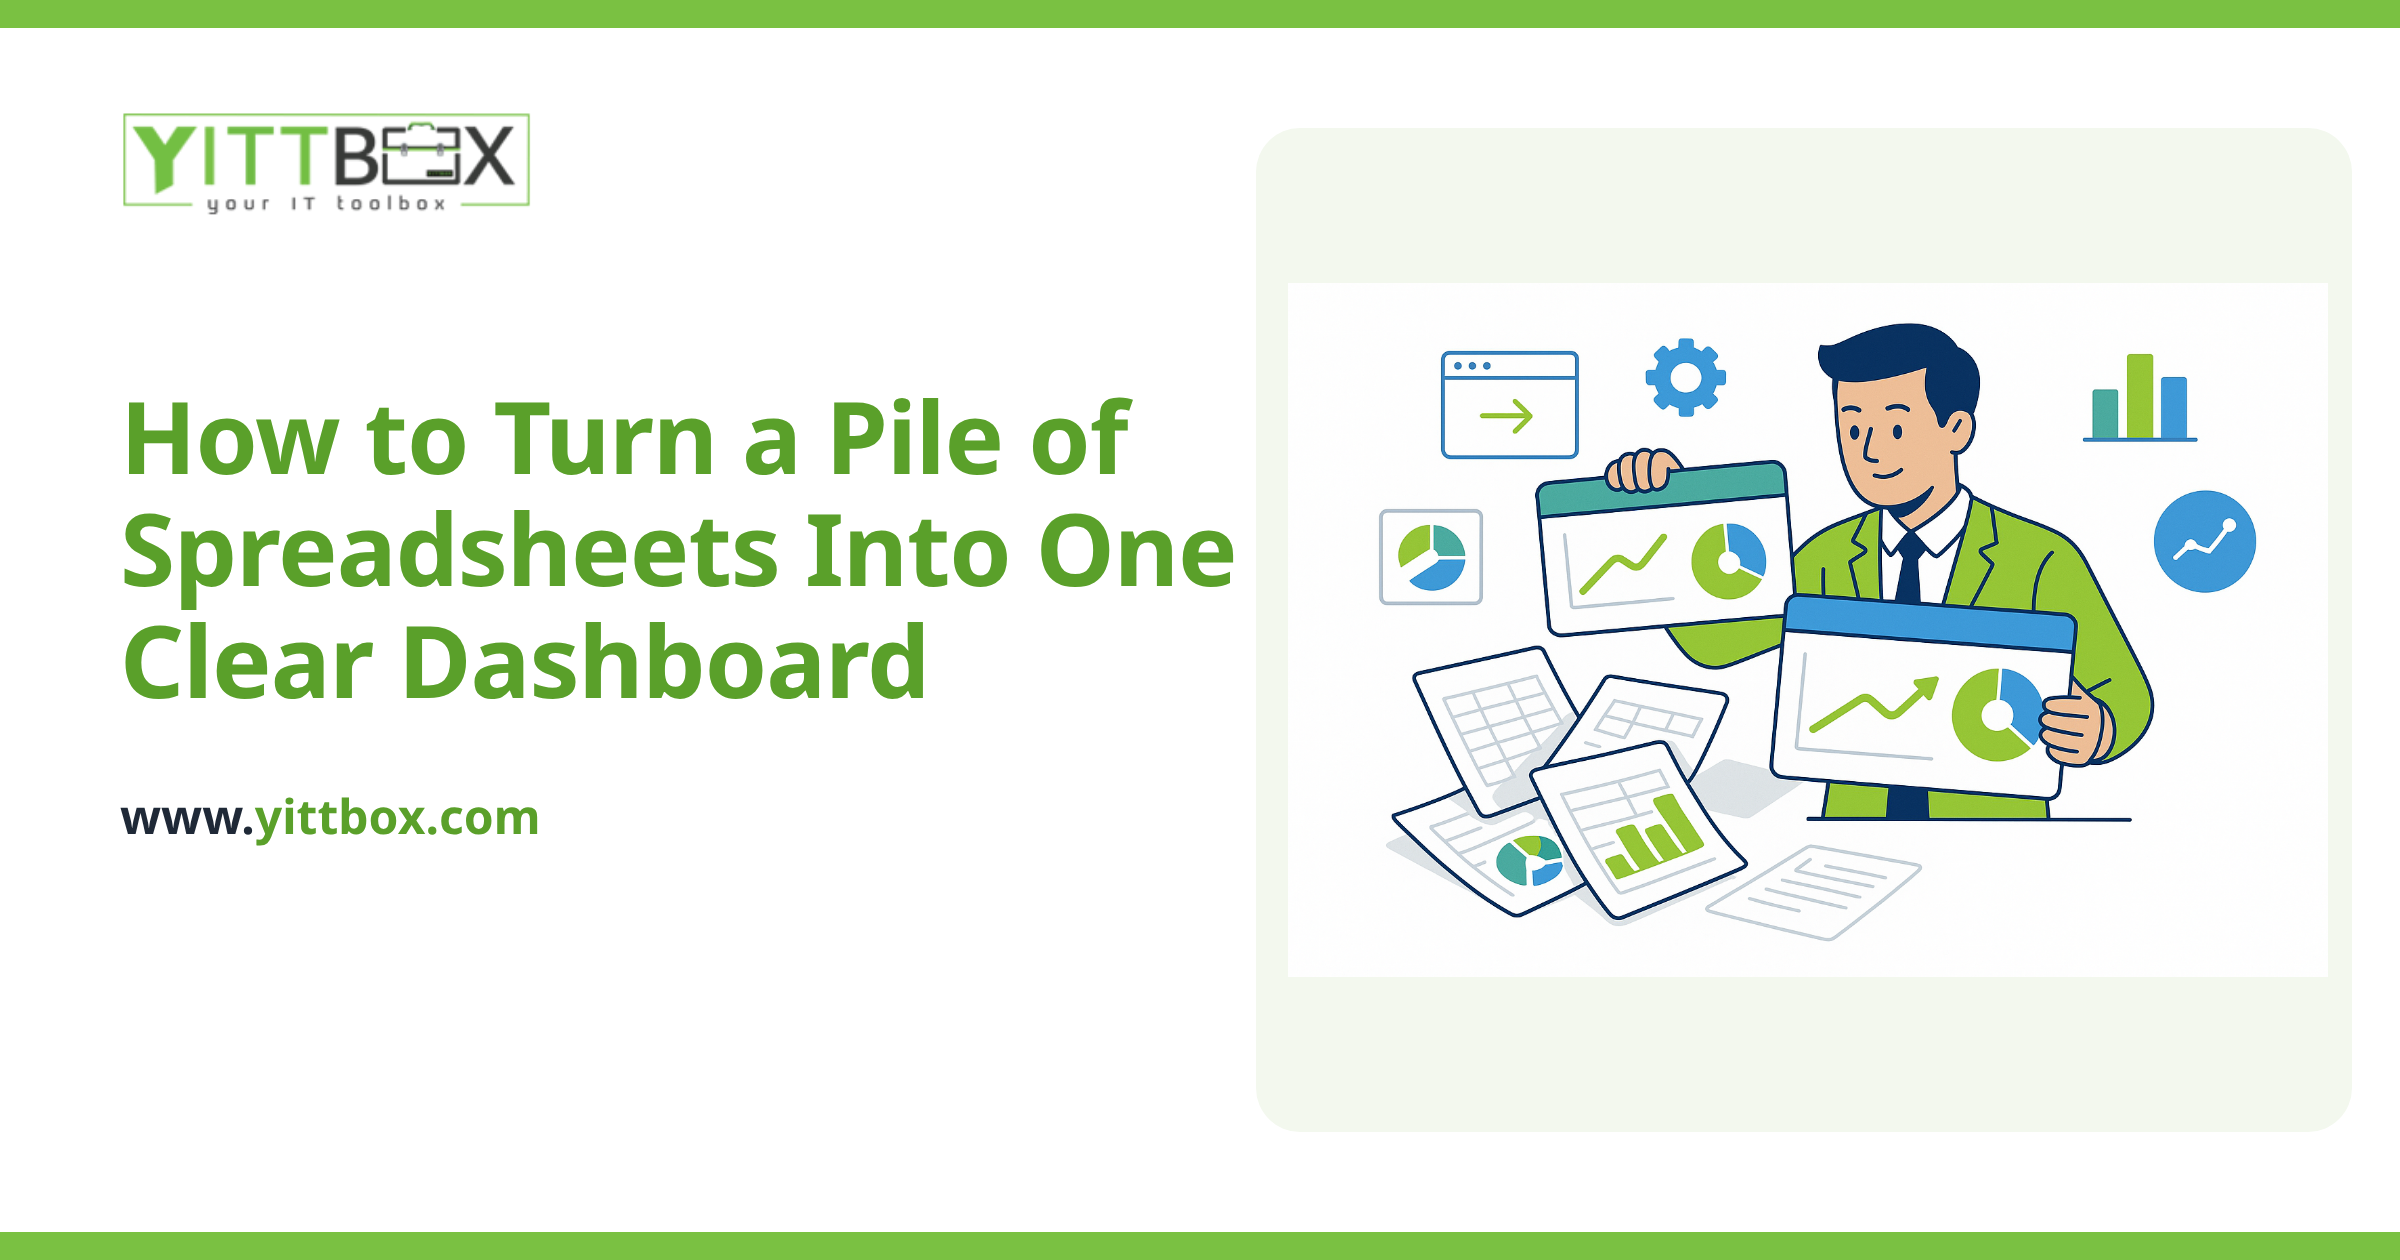

You already have the numbers. Someone on your team types them into a spreadsheet every day — sales figures, job statuses, stock levels, hours worked. The trouble is, to actually see where things stand, you have to open that file, scroll around, maybe copy a few cells into another sheet, and hope nobody else has it open at the same time. By the time you've built your weekly summary, the numbers have already moved on.
A live dashboard fixes that. Instead of chasing figures, you get a single screen that shows the state of your business right now — and it updates on its own the moment your team enters data. Here are the questions small-business owners ask us most often when they're thinking about making that jump.
What exactly is a live dashboard?
A live dashboard is a single screen — usually a web page you open in a browser — that pulls in your latest data and displays it as clear totals, charts, and lists. When someone on your team records a new sale, completes a job, or updates a stock count, the dashboard reflects that change straight away. Nobody has to rebuild a report. You just look at the screen and the current picture is already there.
How does it update by itself when my team enters data?
The key is that everyone enters data into one shared place instead of separate copies of a spreadsheet. That's usually a simple web form or a shared database behind the scenes. When a team member submits an entry, it's saved centrally, and the dashboard reads from that same central source. So the flow looks like this:
- Your team enters data through a form or an app on their phone or computer.
- The entry is saved to one central database that everyone shares.
- The dashboard reads from that database and shows the up-to-date totals automatically.
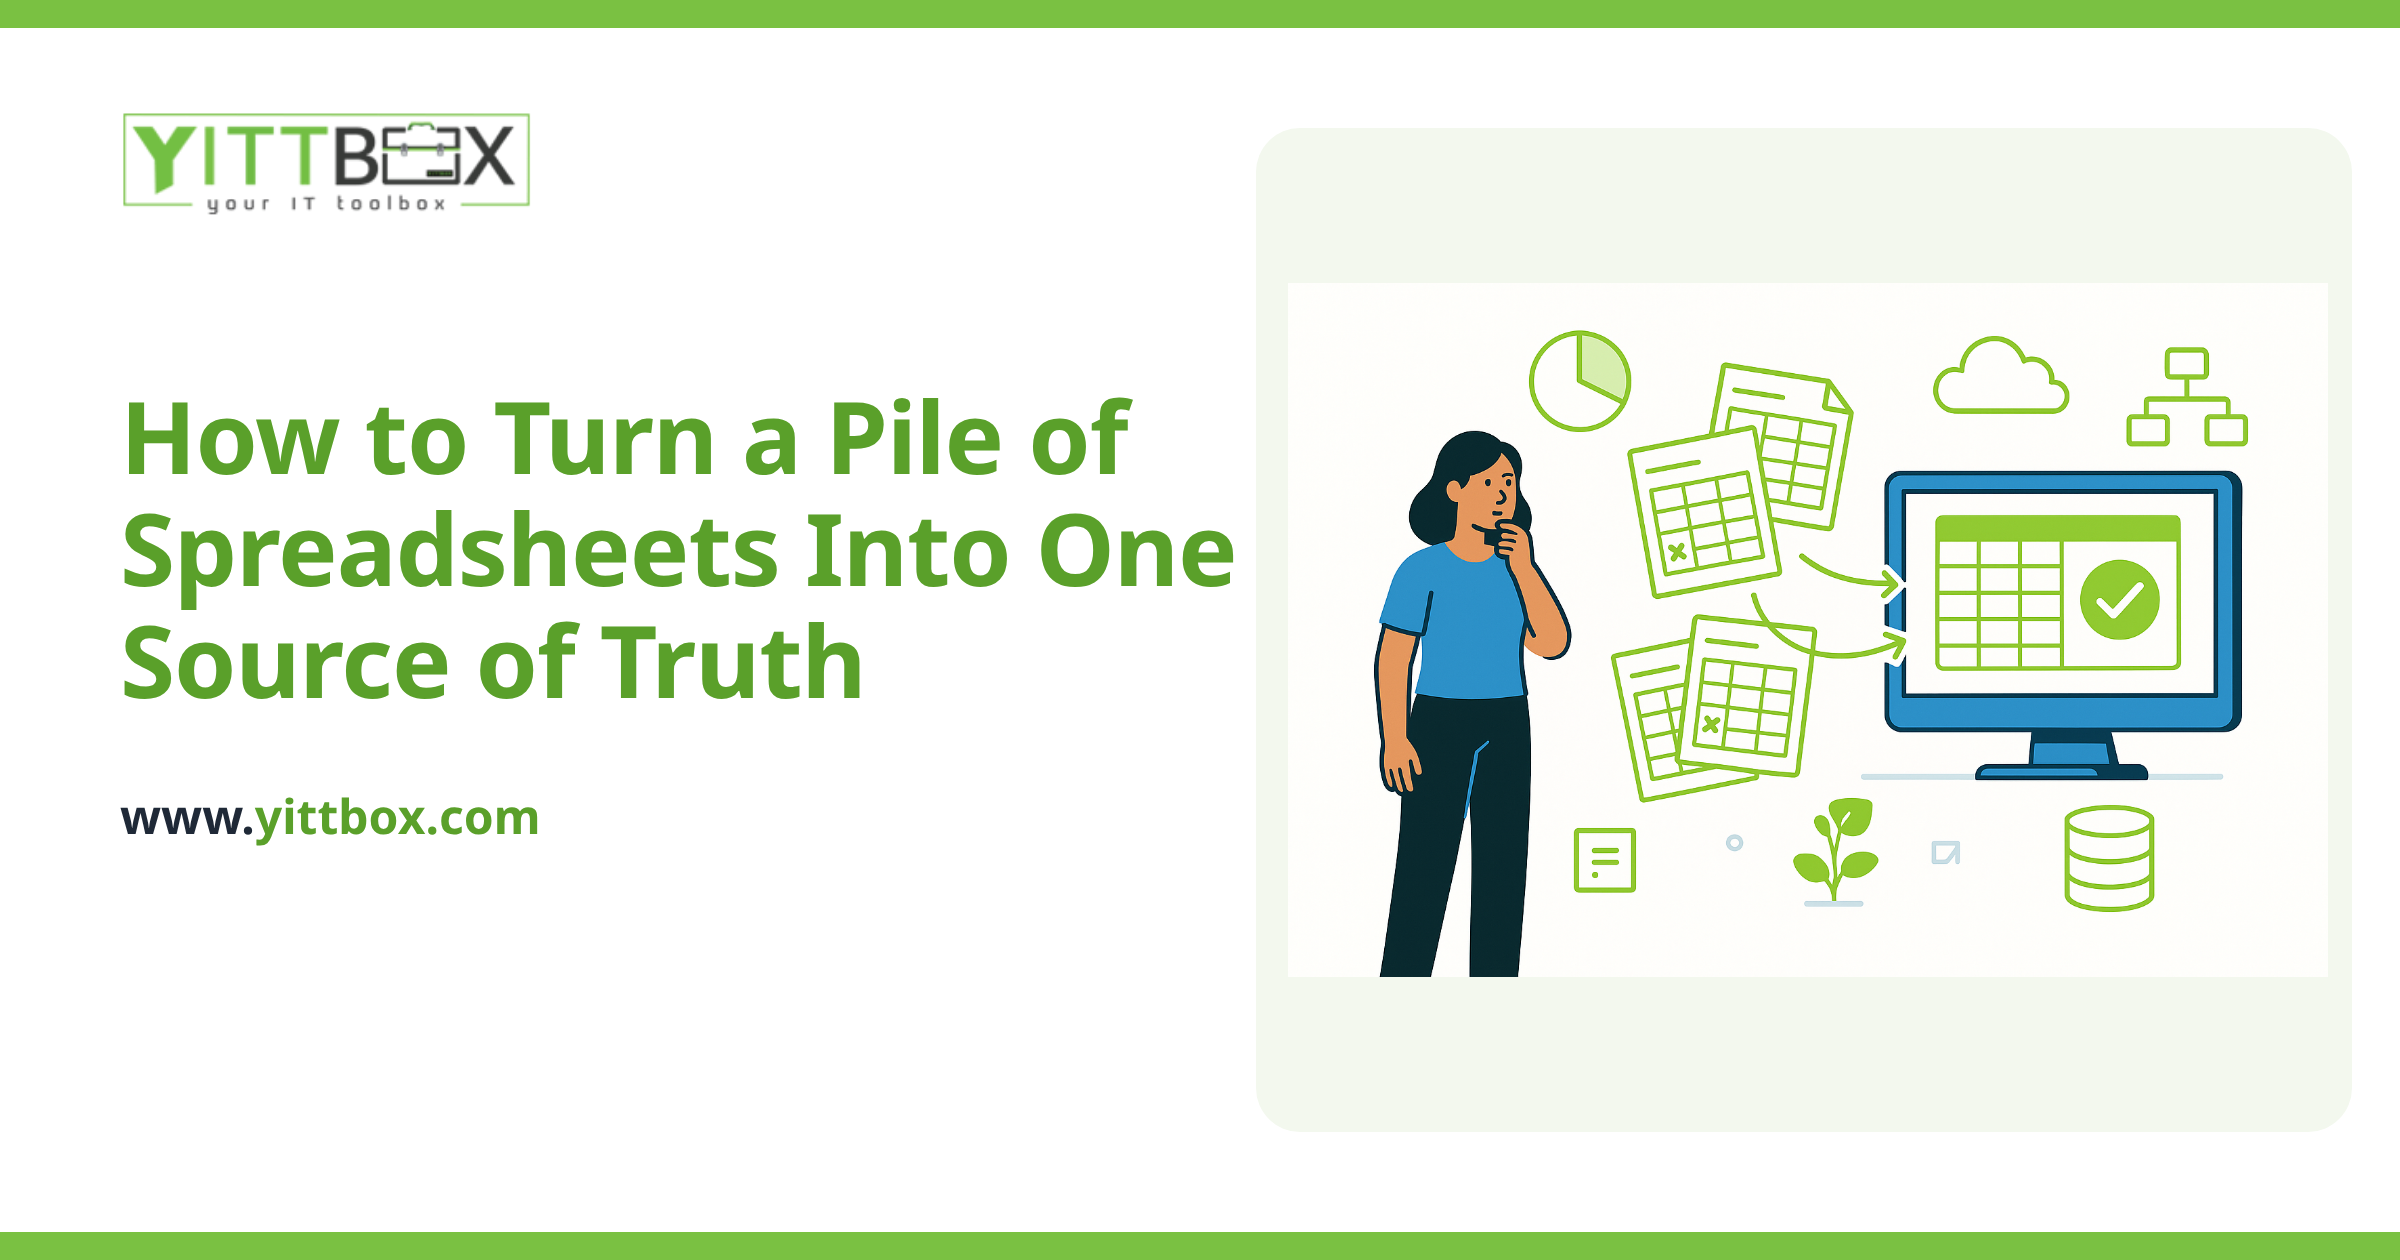
There's no manual copying, no emailing files back and forth, and no risk of two people editing conflicting versions. Moving from scattered spreadsheets to one shared source is often the biggest single improvement a small business can make, and it's exactly the kind of work we cover on our spreadsheet conversion page.
Do I have to throw away my spreadsheets to do this?
No. In most cases we start from your spreadsheets. They already contain your logic, your categories, and the way you think about your business — that's valuable. We take that structure and rebuild it as a proper shared system with a dashboard on top. Your team keeps working in a way that feels familiar, but the fragile parts — the broken formulas, the accidental overwrites, the “which file is the real one?” confusion — go away.
What can I actually show on a dashboard?
Whatever matters to how you run the business. There's no fixed template. Common things owners like to see at a glance include:
- Today's totals — sales, bookings, jobs completed, calls logged.
- Trends over time — this week versus last, this month versus the same month last year.
- What needs attention — overdue invoices, low stock, jobs stuck in one stage too long.
- Team activity — who entered what, so nothing slips through the cracks.
The best dashboards are honest and uncluttered. We'd rather show you the six numbers that actually drive decisions than bury them under twenty you'll never look at.
Can my whole team use it, or just me?
Both, and you get to decide who sees what. Many owners want a full view for themselves while giving each team member a focused screen that shows only their area — their jobs, their region, their targets. Because everything lives in one shared system, everyone is looking at the same up-to-date numbers, just filtered to what's relevant to them.
Is this expensive or hard to maintain?
It's usually far cheaper than people expect, and much cheaper than the hidden cost of the manual reporting you're doing now — the hours spent stitching reports together, the decisions made on stale numbers, the mistakes from copy-and-paste. Once it's built, entering data is maintaining it. There's no separate reporting chore to keep up. We build in plain, well-organized ways so the system stays understandable rather than becoming a black box only a specialist can touch. If you'd like a realistic sense of cost for your situation, our free estimate page is the place to start.
How do I know if my business is ready for one?
You're probably ready if any of these sound familiar:
- You wait until the end of the week or month to really know how things are going.
- Two or more people update the same spreadsheet and you've been bitten by overwritten data.
- You spend time each week building the same report by hand.
- You've caught yourself making a decision on numbers you weren't sure were current.
If even one of those rings true, a live dashboard will likely pay for itself in saved time and better decisions.
Where should I start?
Start with a conversation, not a commitment. We offer a free, no-pressure review of how your team currently records and reports data. We'll look at what you already have, tell you plainly what could be improved, and give you an honest view of what a dashboard would involve — with no pushy sales calls and no obligation to go ahead. If you'd like that review, take a look at our free estimate and tell us a little about how your business runs today.
Comments
Be the first to comment on this post.